ITMedic — Ops Intelligence
Live for the shift. Ready for the meeting.
Your department already pays for the systems that hold the answers: CAD, ePCR, rig checks, scheduling, finance. We build the dashboards that put those answers on the station wall when the crew walks in, and the reports that arrive at the board meeting already done. Built in Power BI, in your department’s own Microsoft 365 tenant.
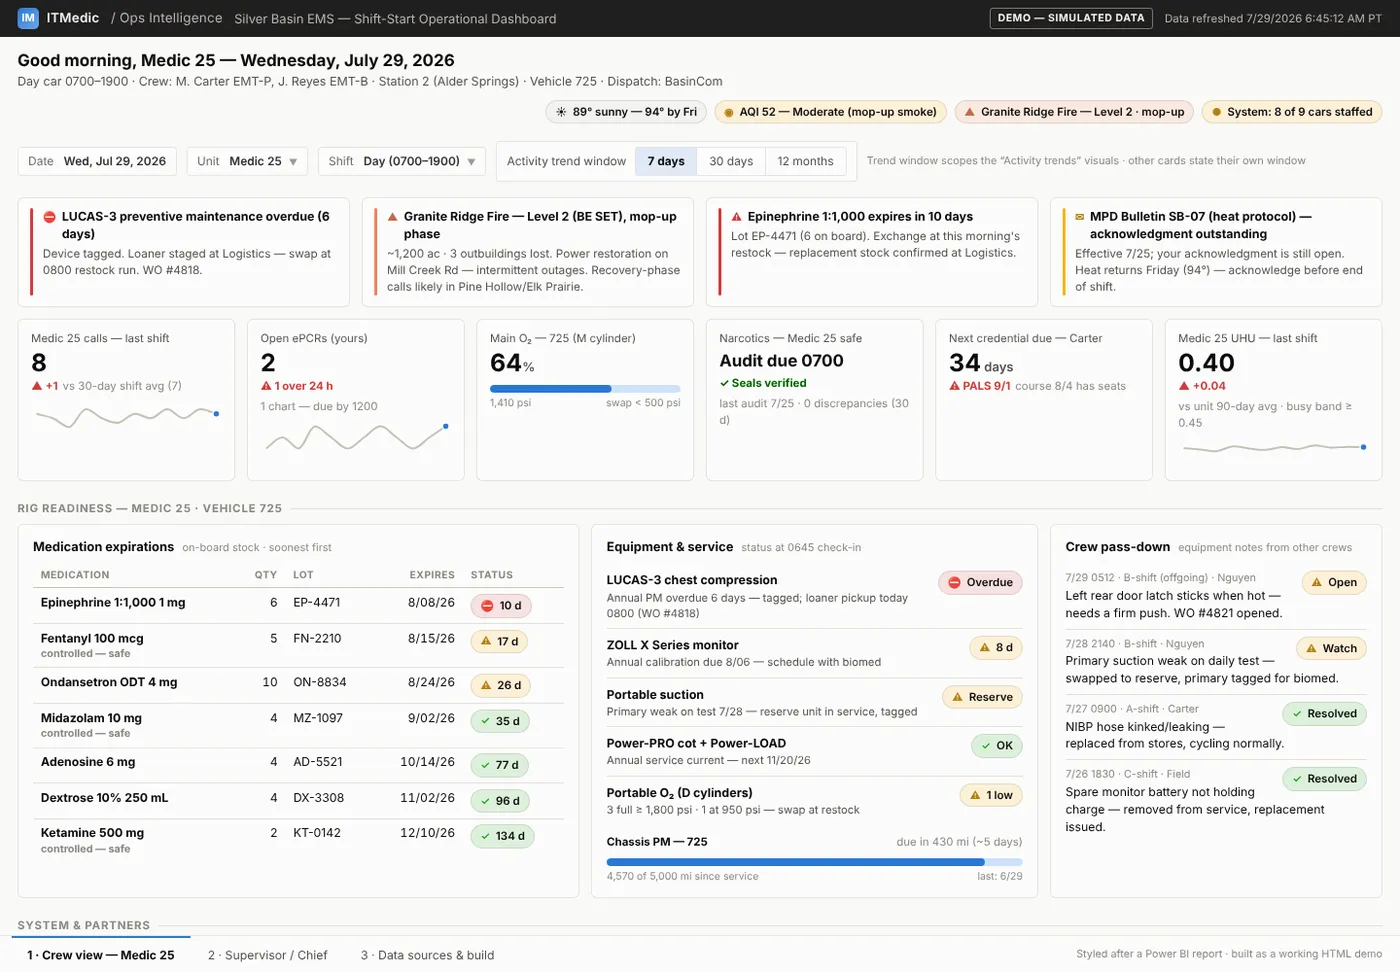
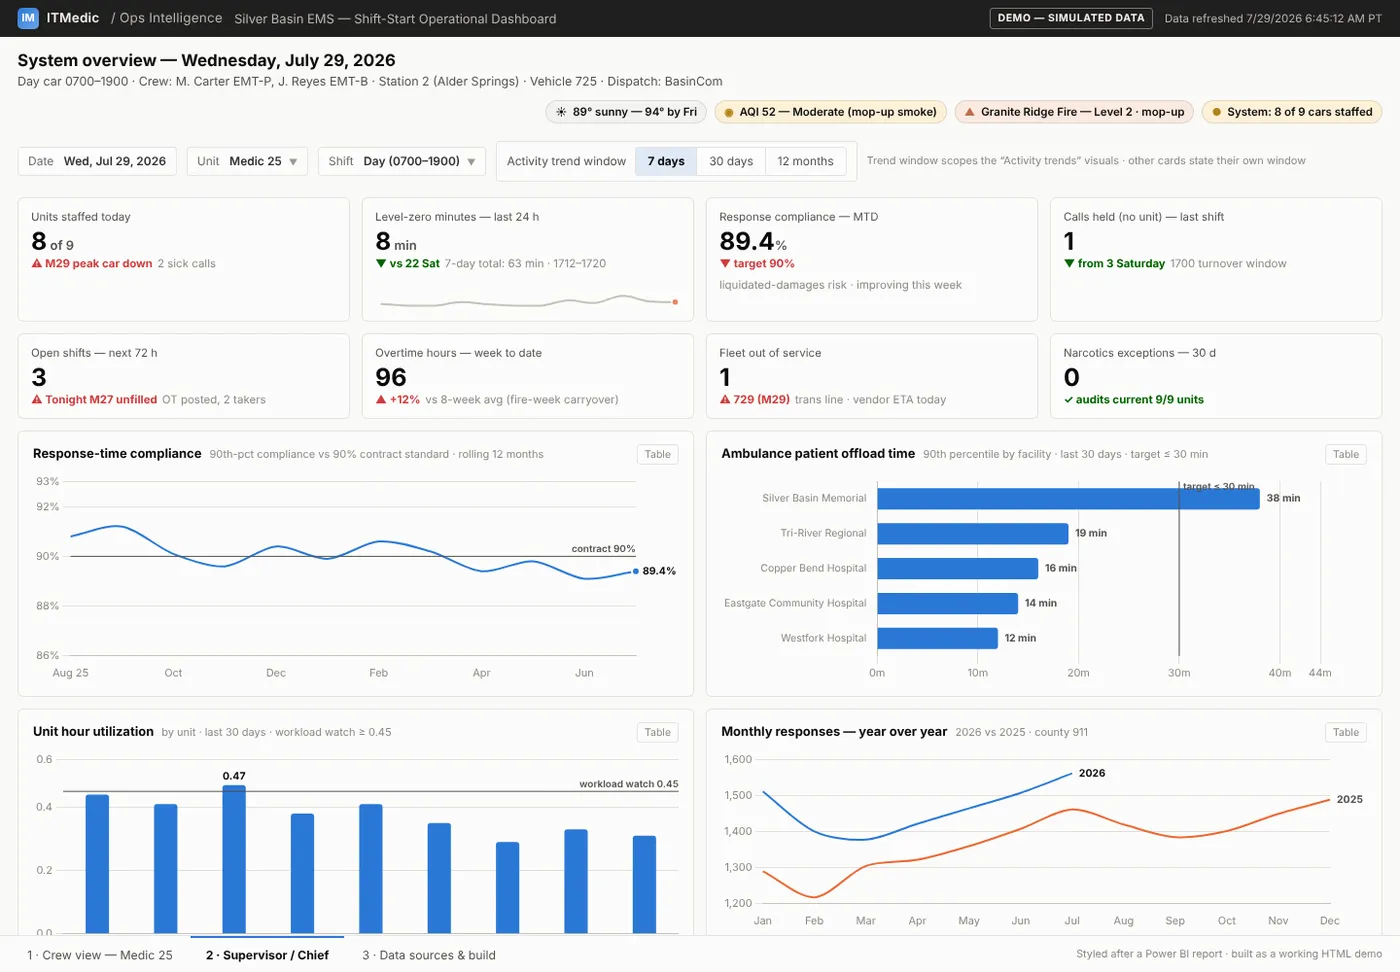
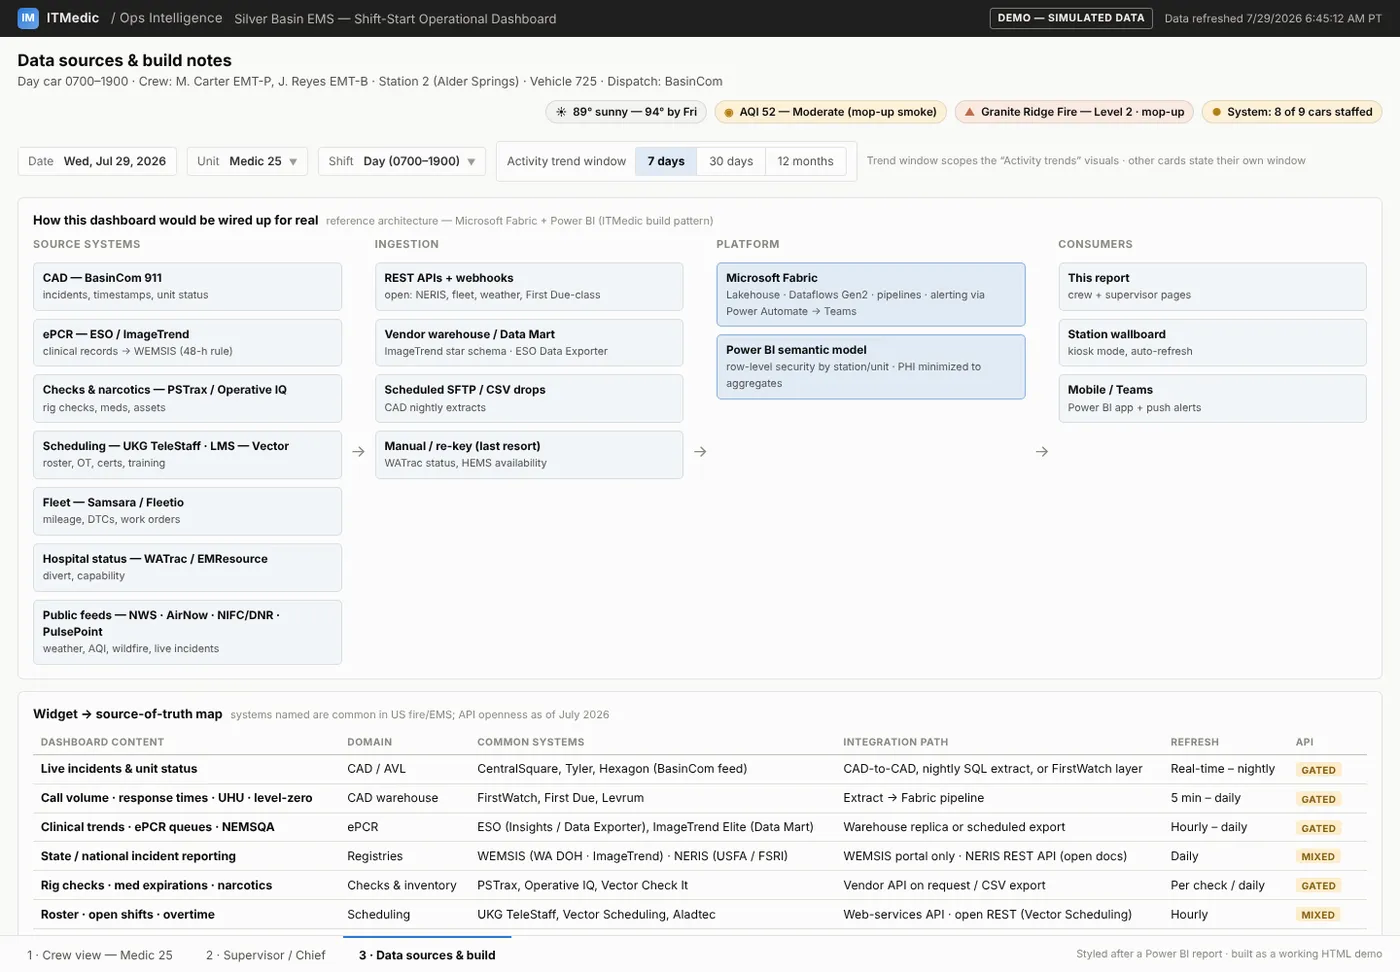
The Shift-Start SITREP, crew view. An invented agency on simulated data; click through all three pages.
Two jobs, one set of numbers
On the station wallboard, the MDT, a phone or in Teams. Each card is as fresh as its feed, says so, and grays out when the feed stops.
- The Shift-Start SITREP for crews and the duty officer
- Command center: units, incidents, response times, staffing
- Threshold alerts to Teams when something needs a person
The board meeting, the budget hearing, the rating evaluation, the program review. The same numbers, laid out for the people in the room and produced on schedule, not rebuilt by hand the night before.
- The monthly board packet, generated as a PDF
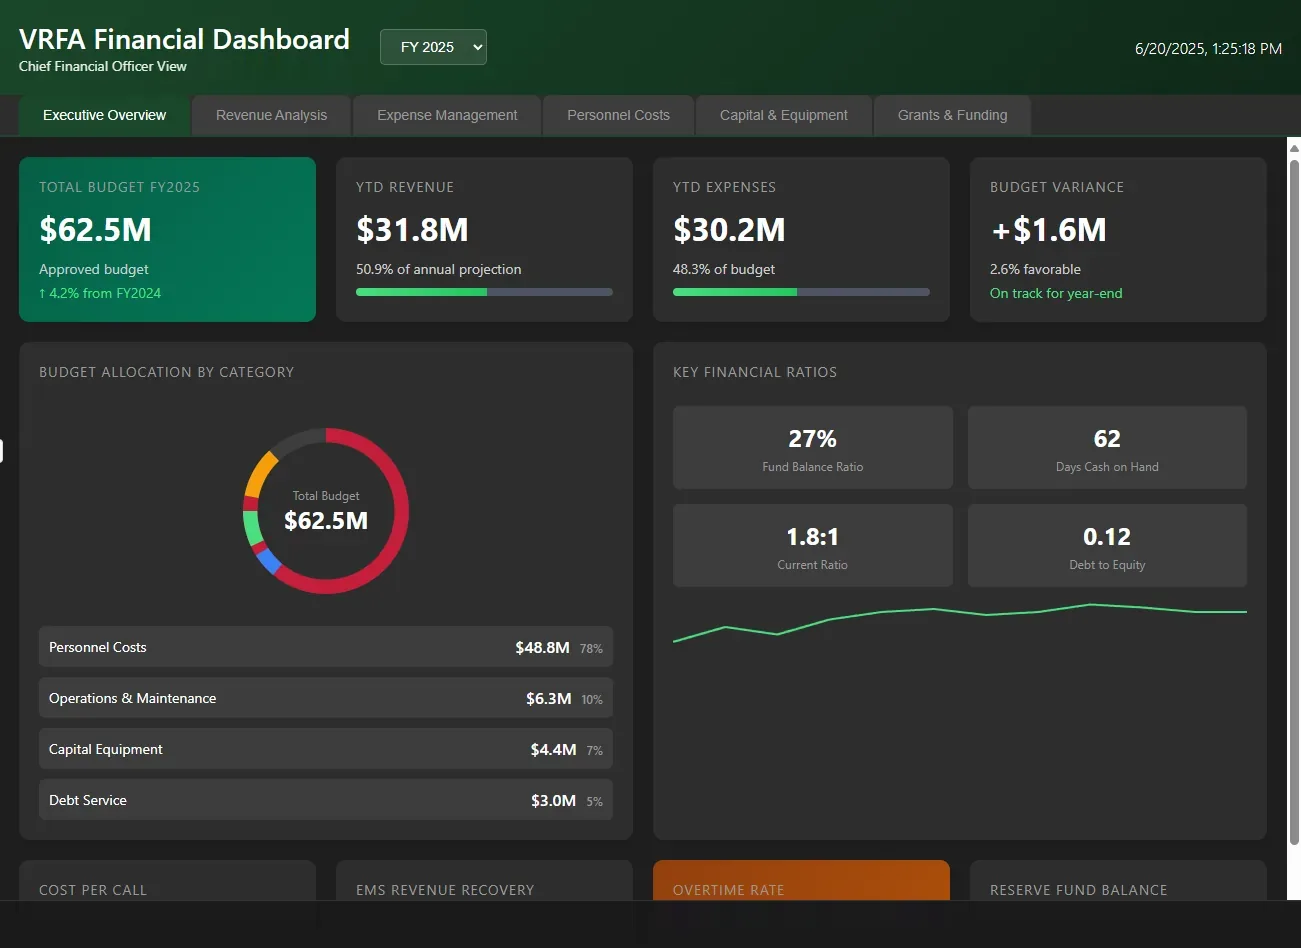
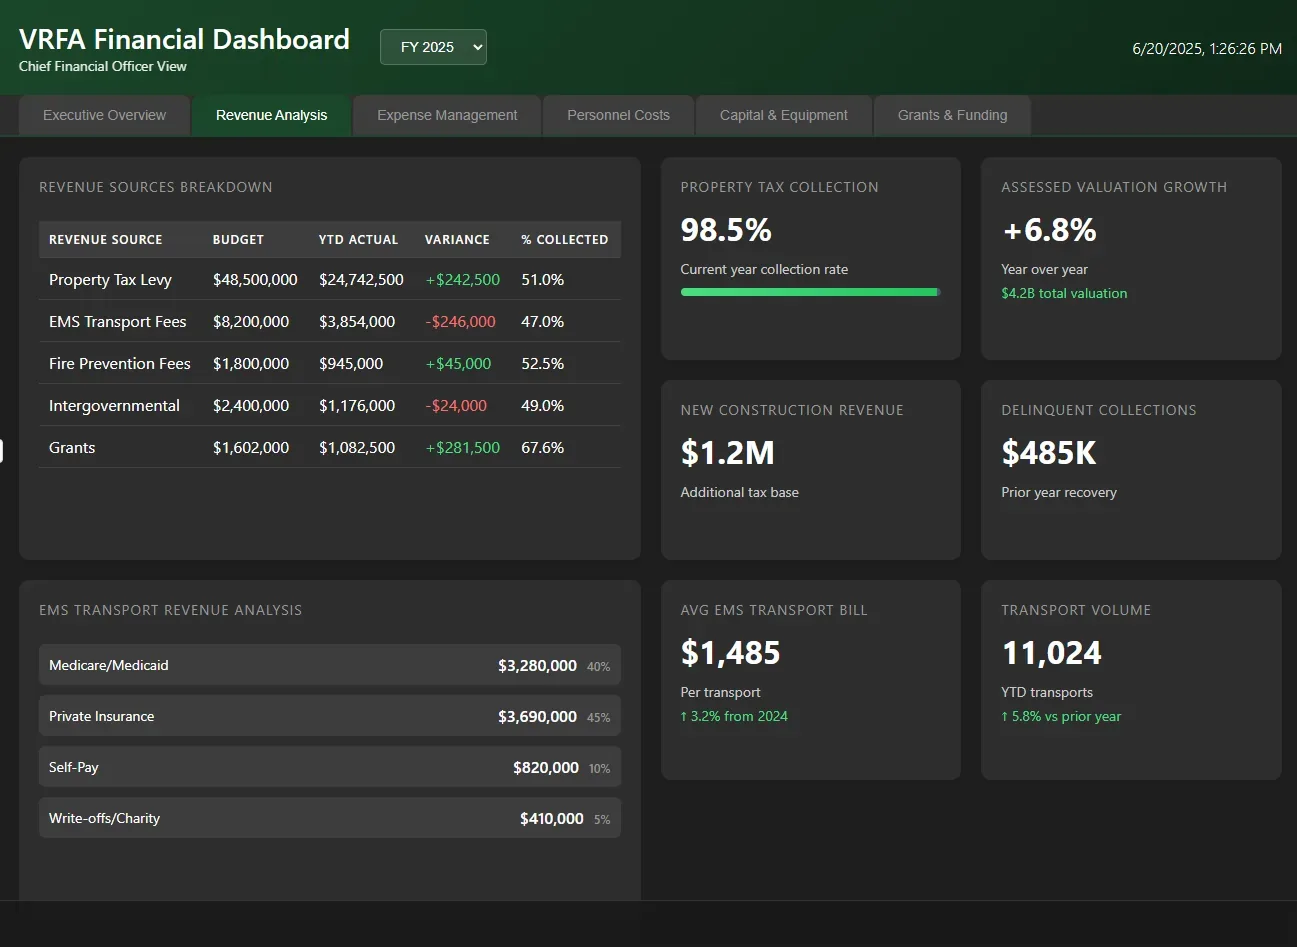
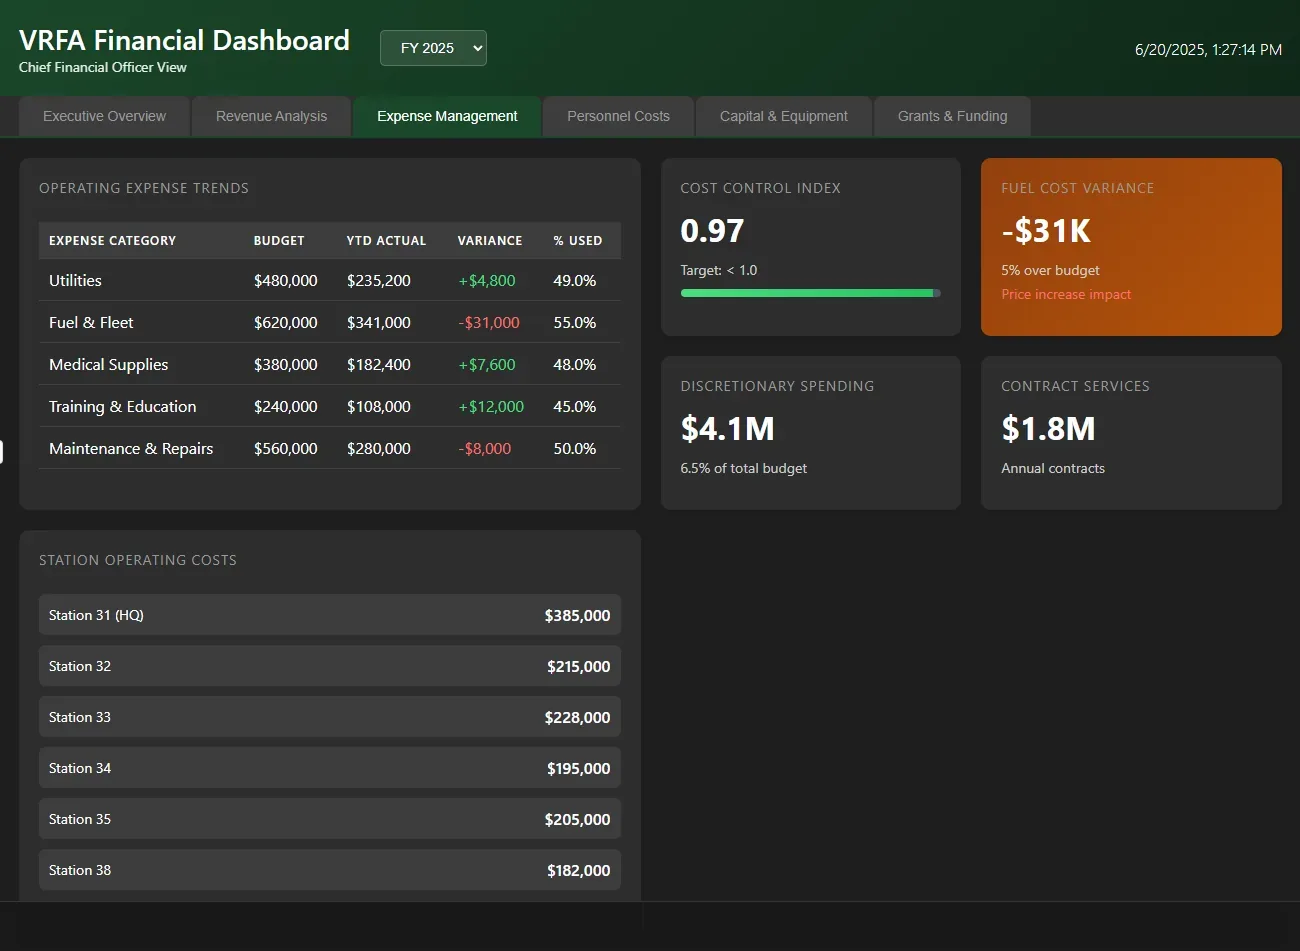
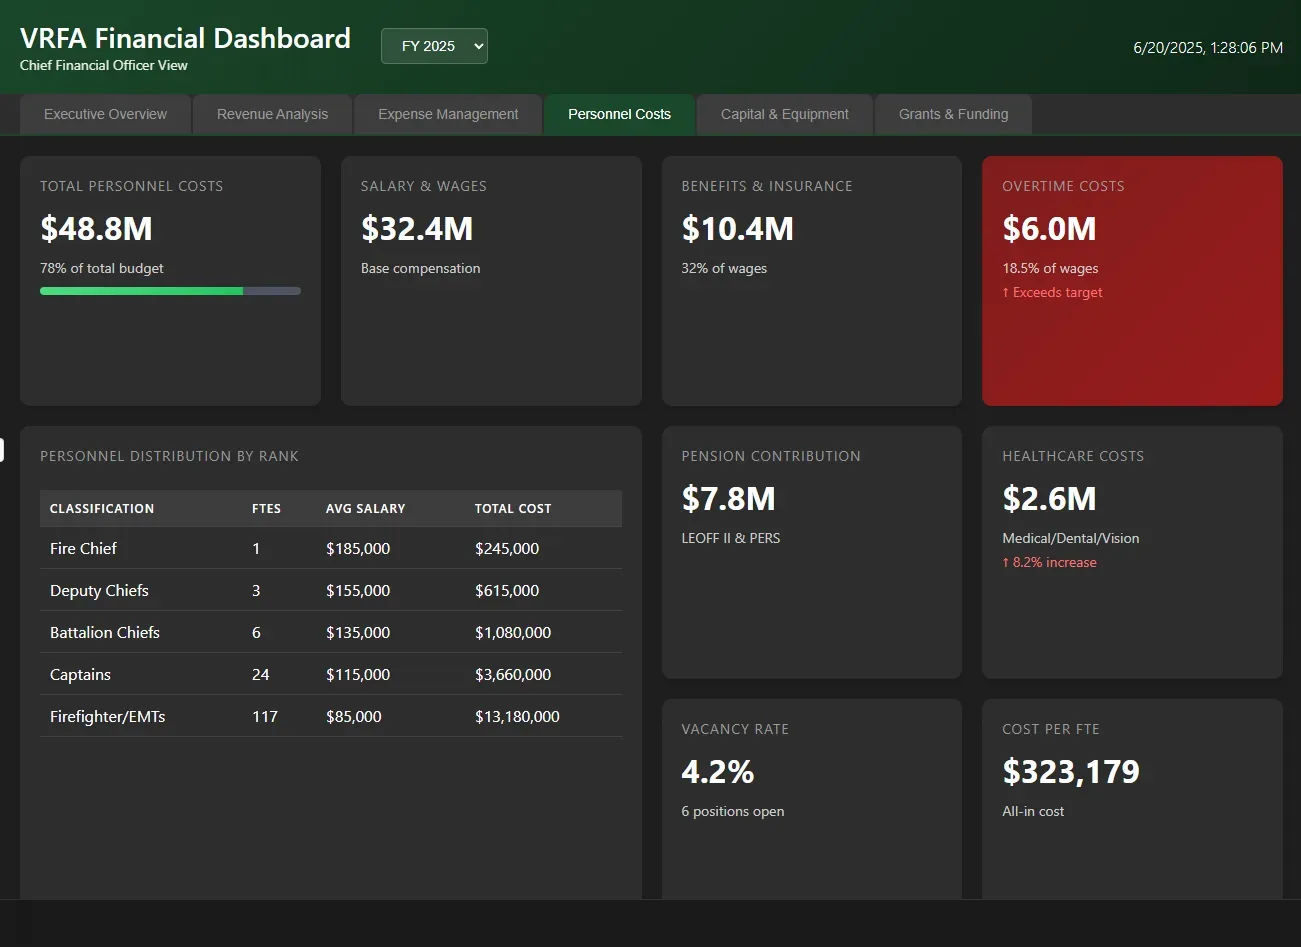
- Finance for the CFO and the budget committee
- Training, rating and program reports for the people who ask for them
Which meeting are you preparing for?
| The meeting | The report we build for it |
|---|---|
| Shift change, every day | The Shift-Start SITREP: the rig, the system and the day on one pane, a crew page and a chief page. |
| The monthly board meeting | The command center summary and the board packet, from the same model the wallboard reads. |
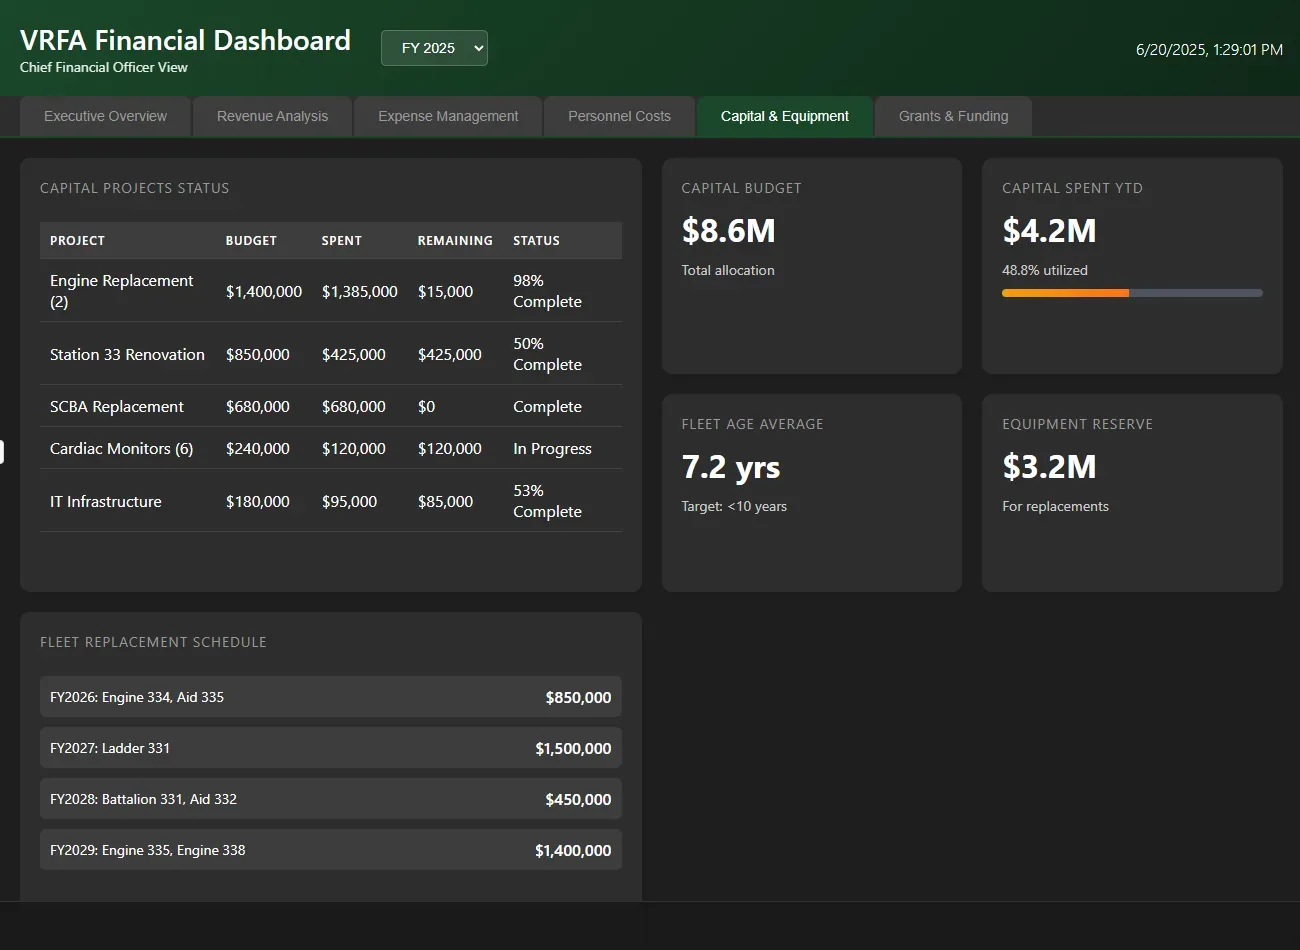
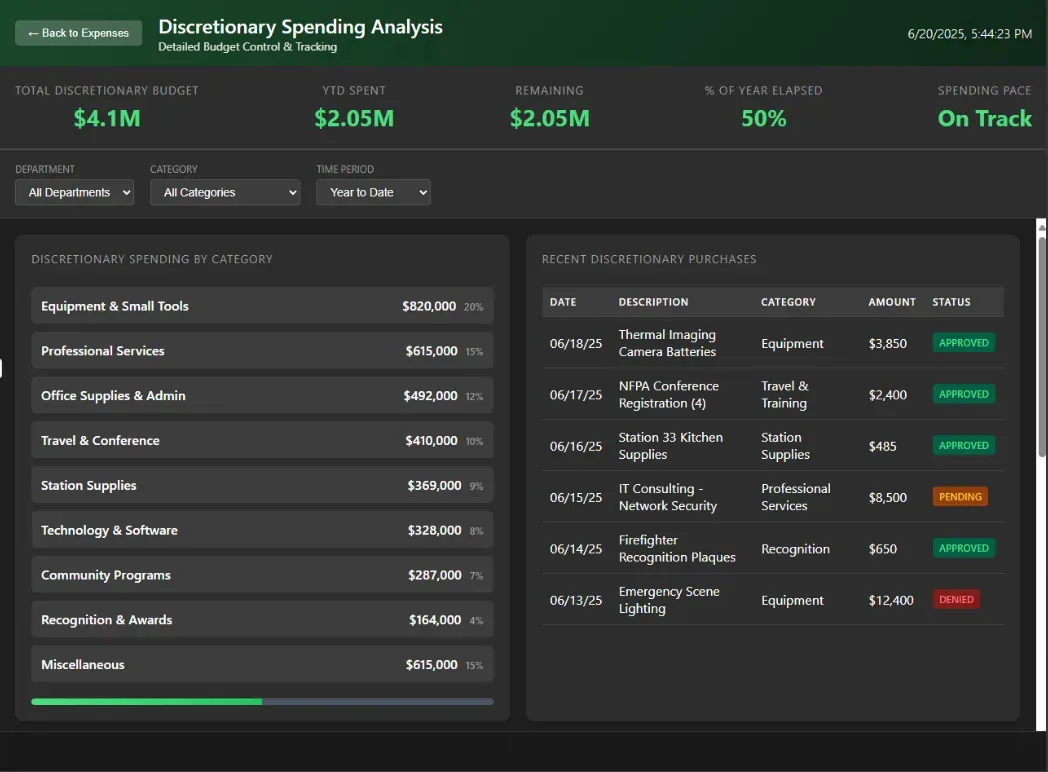
| The budget hearing and levy season | The financial dashboard: revenue, expenses, personnel, capital, grants and discretionary spending. |
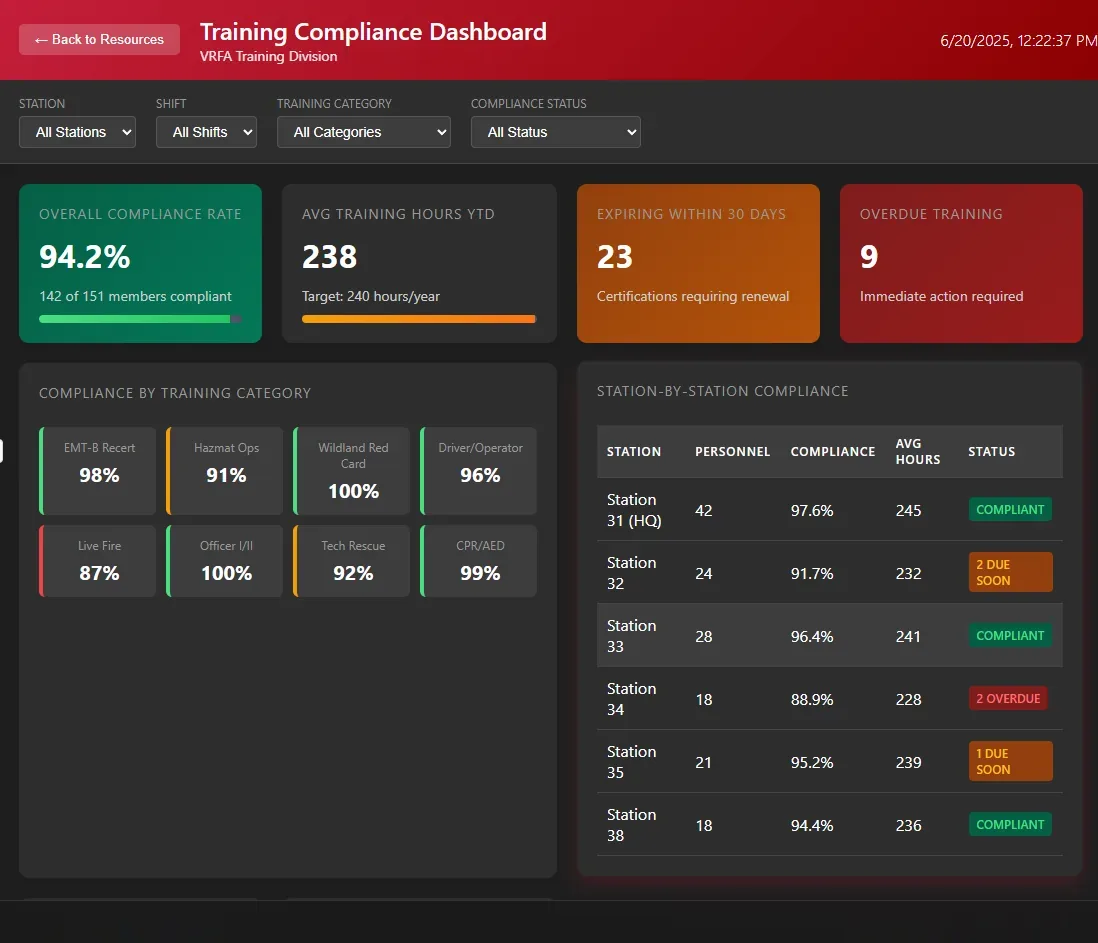
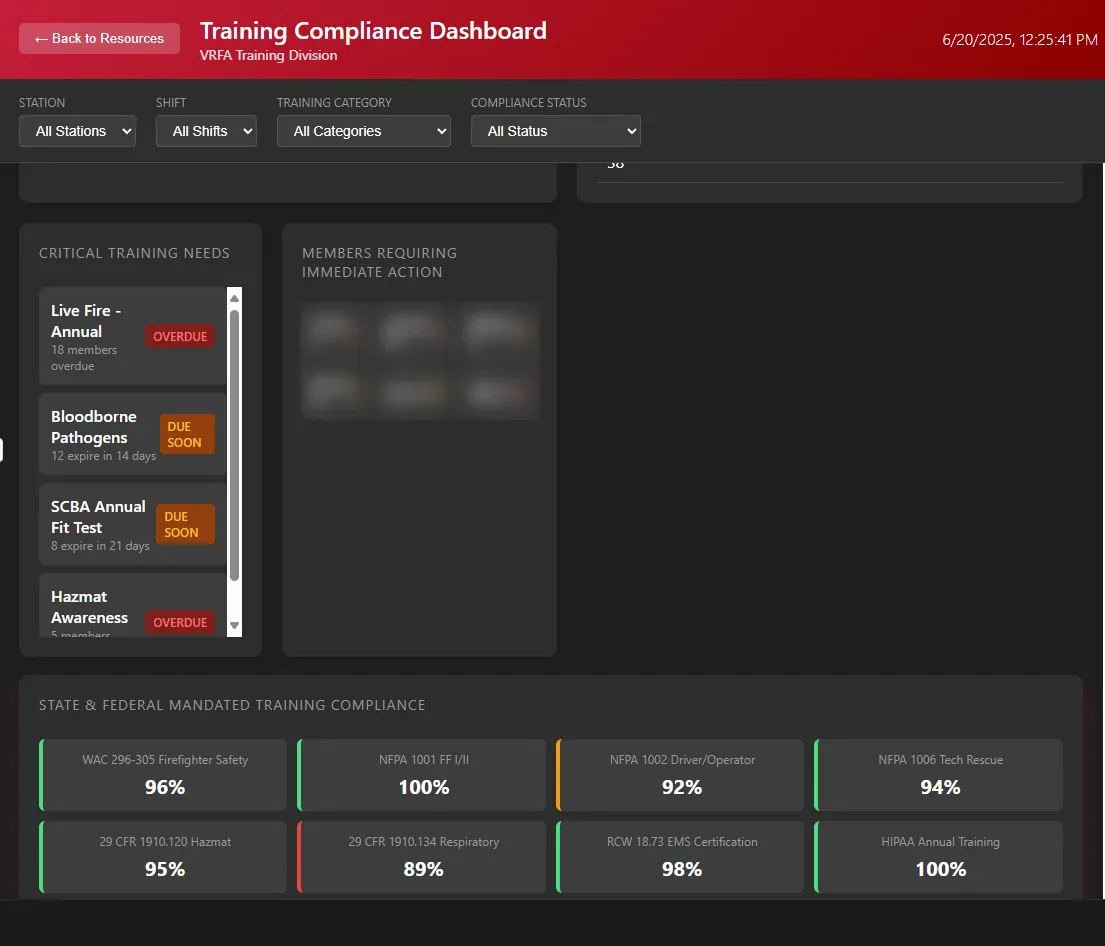
| The training officer and the state audit | Training compliance by category, by station and against the state and federal mandates. |
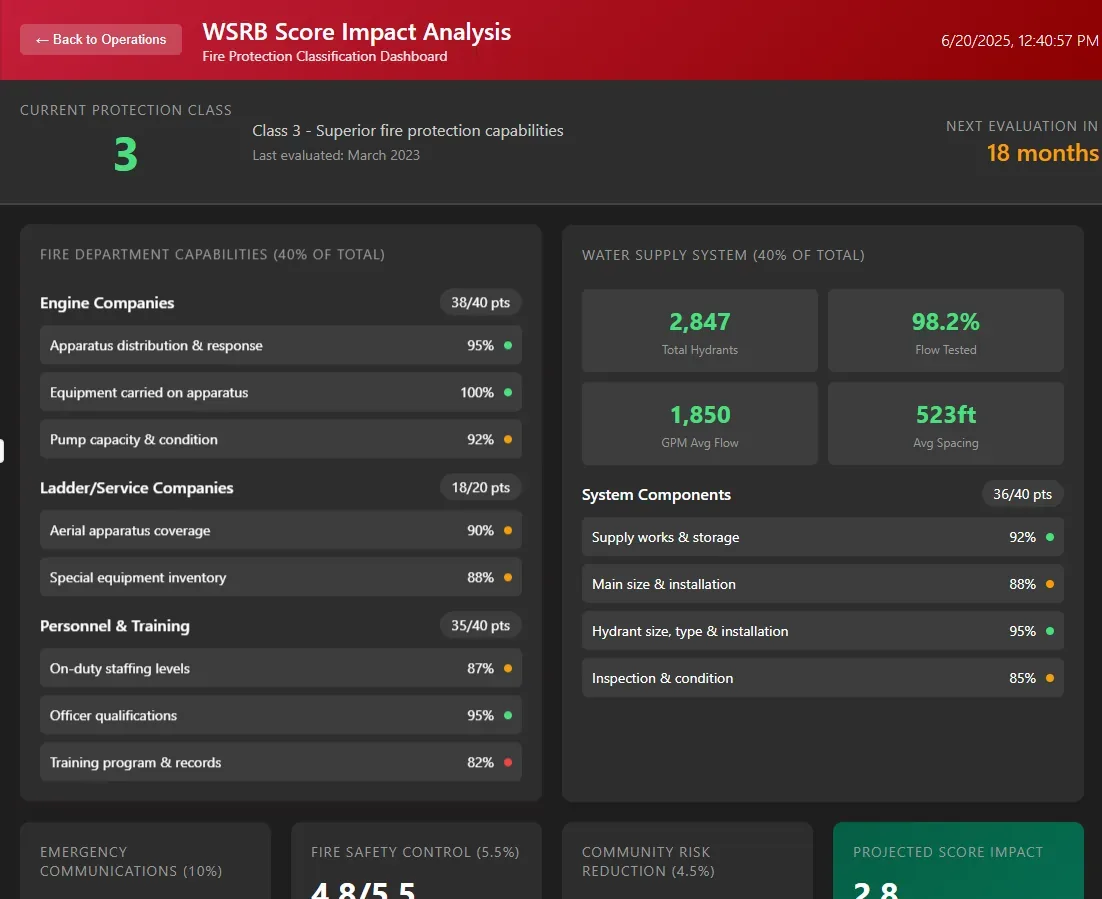
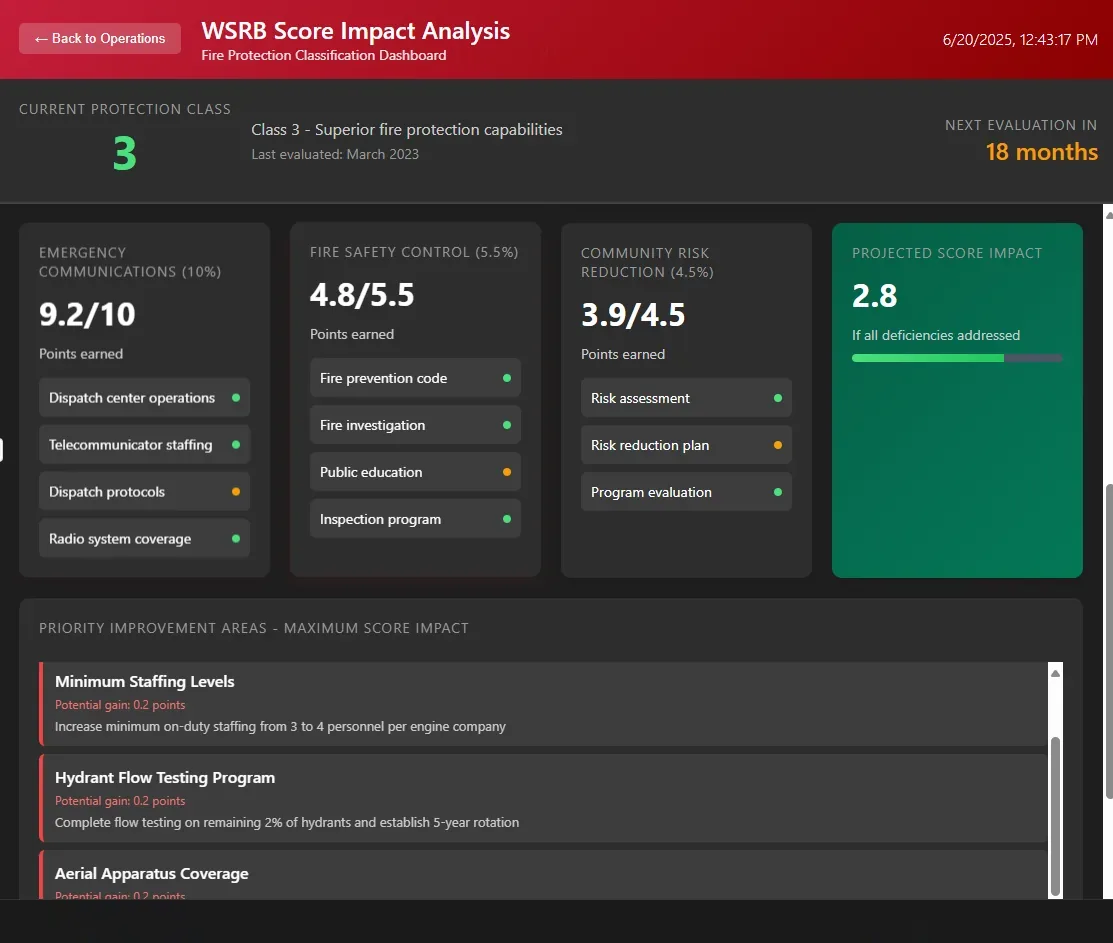
| The protection-class evaluation | The WSRB score by category, with the improvements that move it most. |
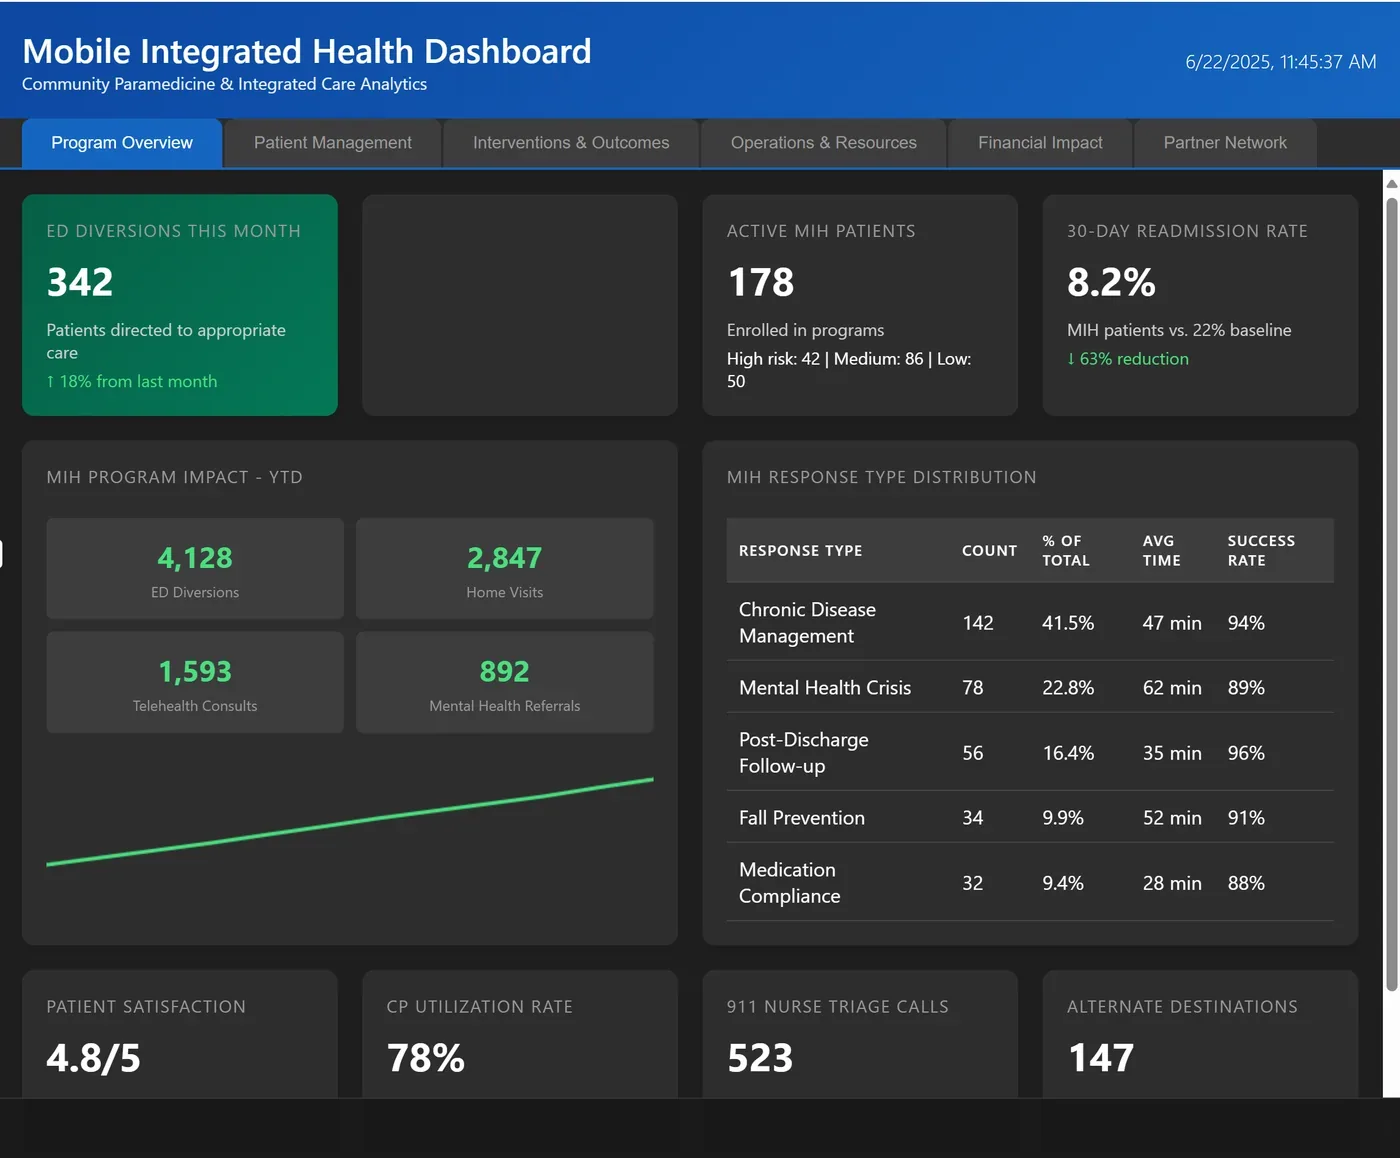
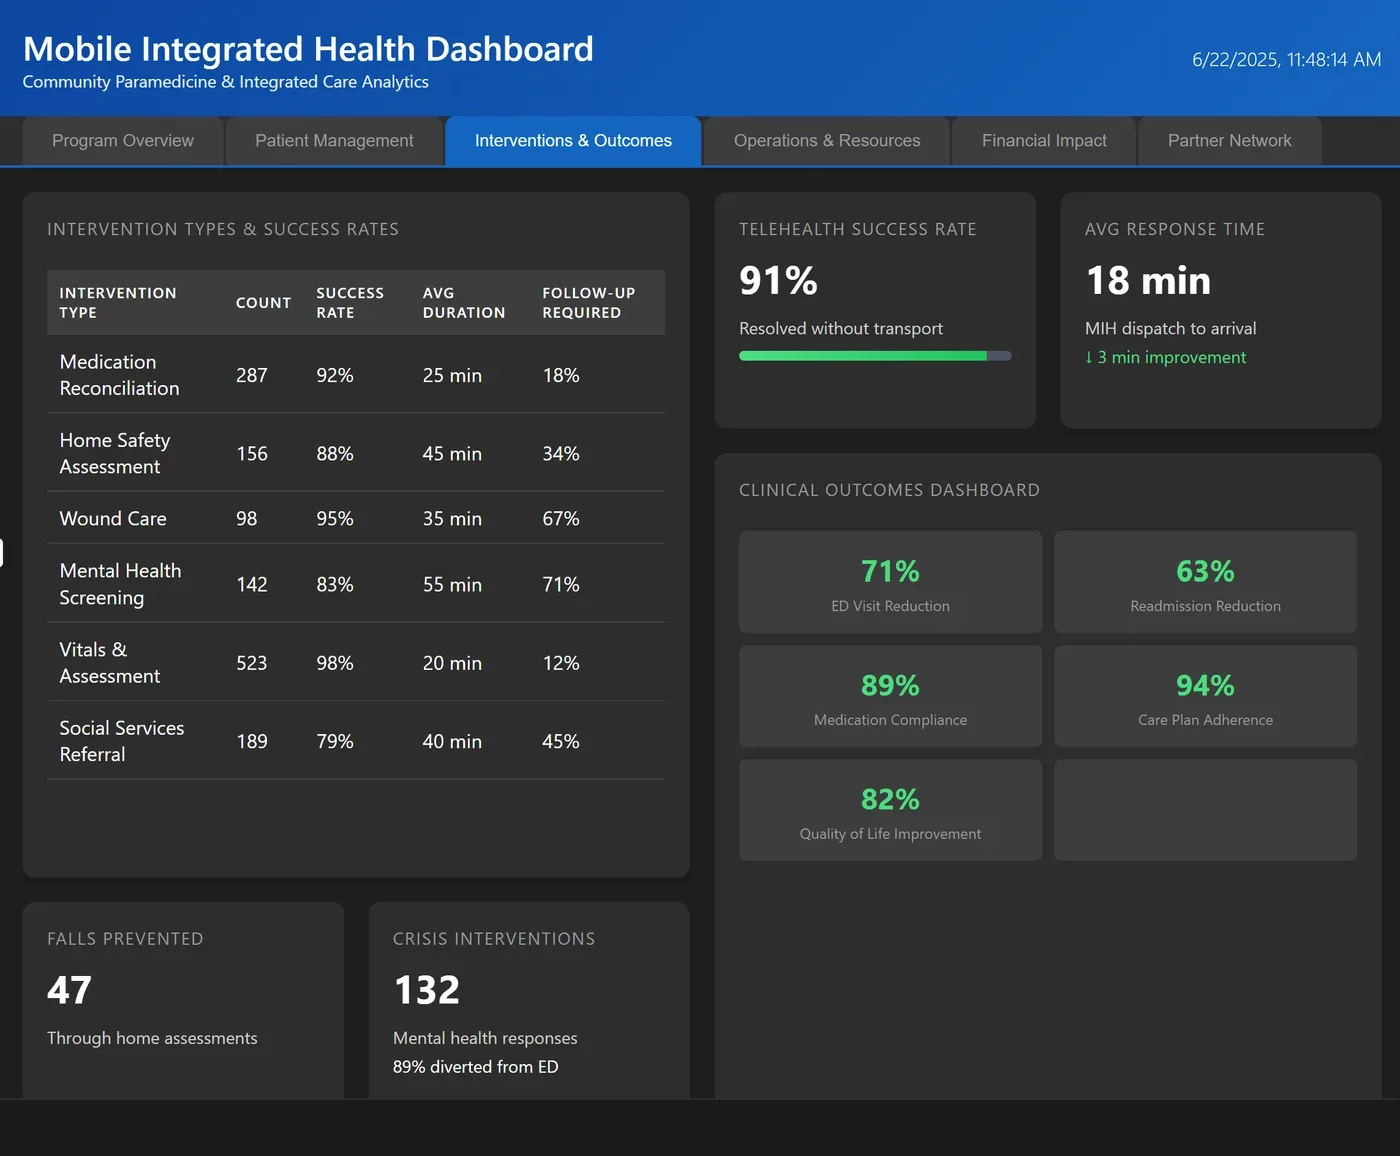
| Hospital, county and grant partners | Mobile integrated health: the program, its interventions, its operations and its financial impact. |
The Shift-Start SITREP
Start every shift informed.
Your crews start every shift the same way their predecessors did: check the rig, count the narcs, ask the offgoing crew what broke, and guess what kind of day the system is having. Meanwhile the answers already exist — in the software your department pays for. They’re just spread across a stack of logins, a few bulletin boards, and one email inbox nobody opens before the first call.
- Priority alerts, acknowledged and tracked
- Rig readiness — meds, O2, SCBA, service countdowns
- Pass-down log with open work orders
- Hospital, HEMS & mutual-aid status
- Today’s hazards, events, closures & GIS changes
- Staffing, coverage & concurrency pressure
- Response-standard compliance, month to date (RCW 52.33)
- Documentation, training & fleet queues
- Mission modules — MIH, transport, wildland, finance
- The month’s board packet, generated — not rebuilt
Reports we have built
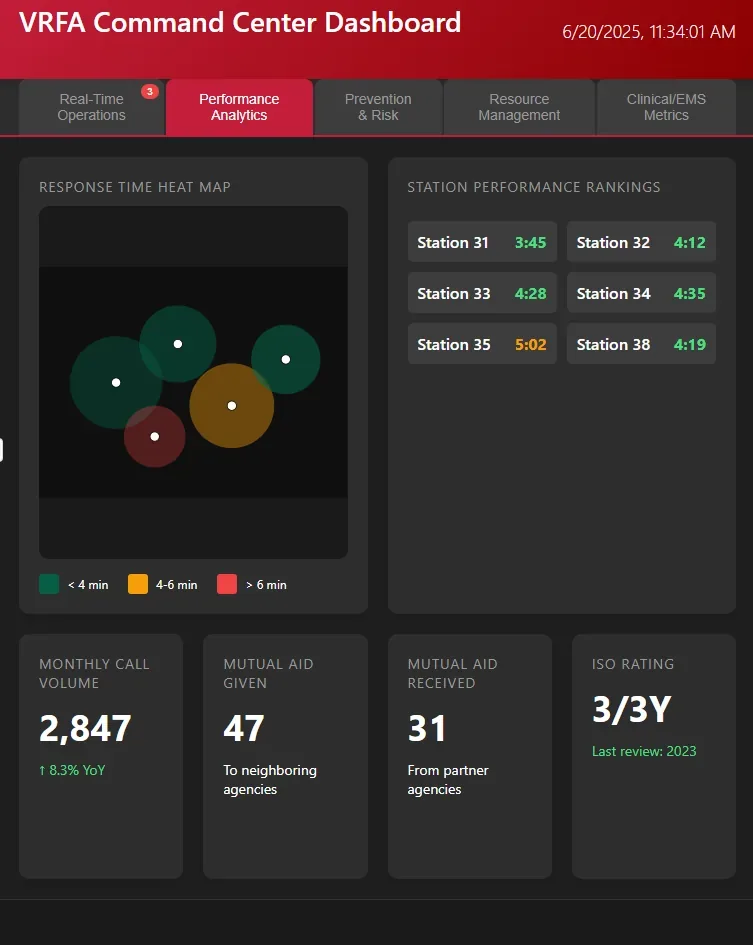
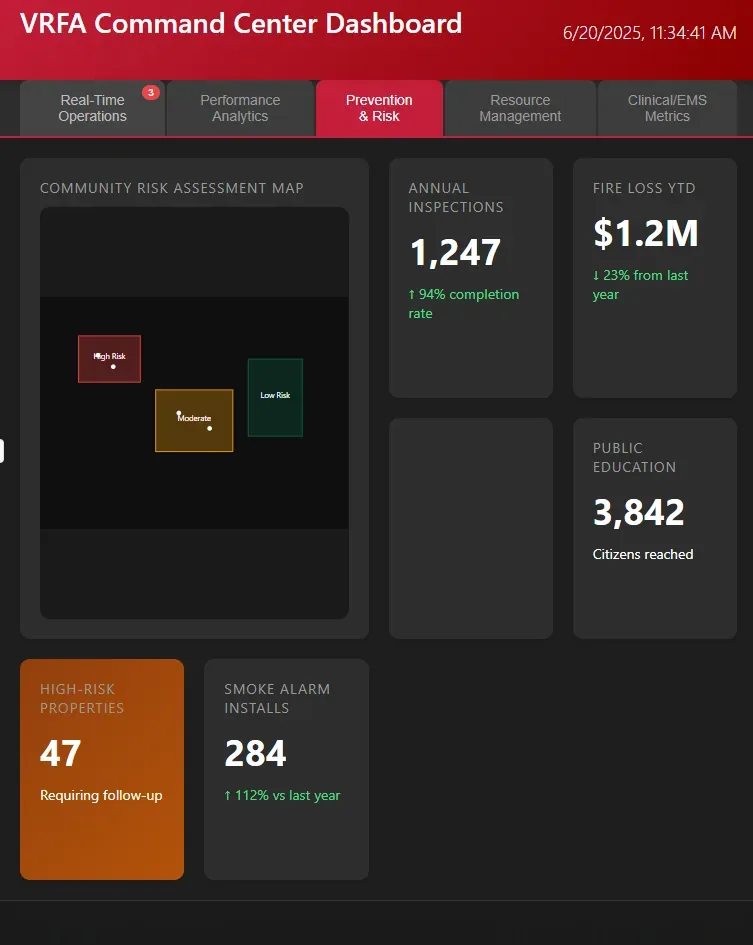
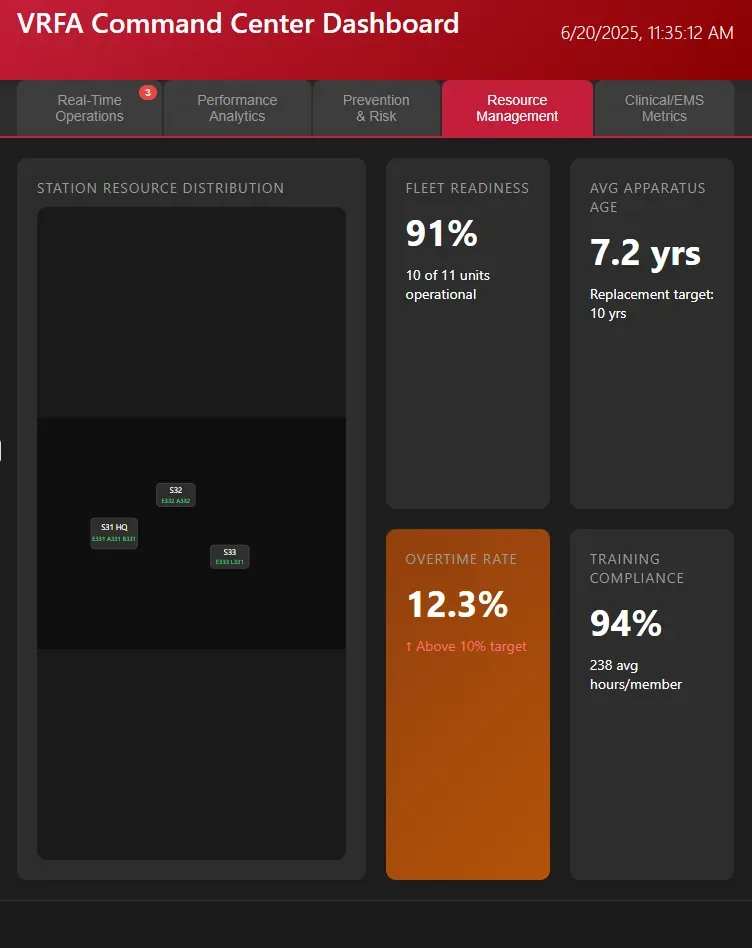
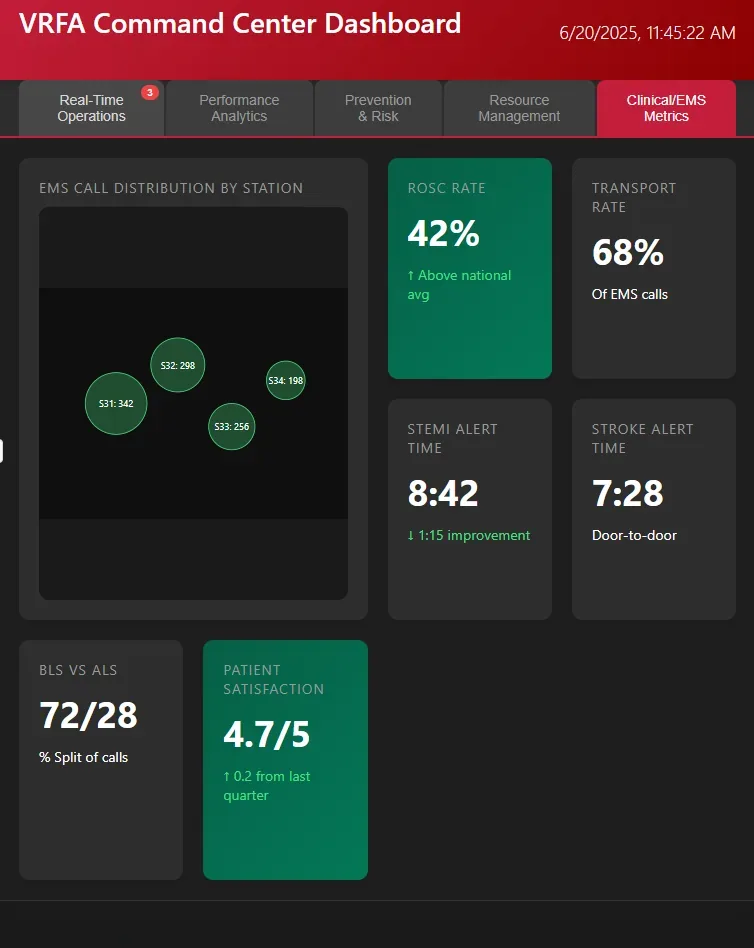
Screens from our demonstration builds for fire and EMS. Select any screen to see it full size.
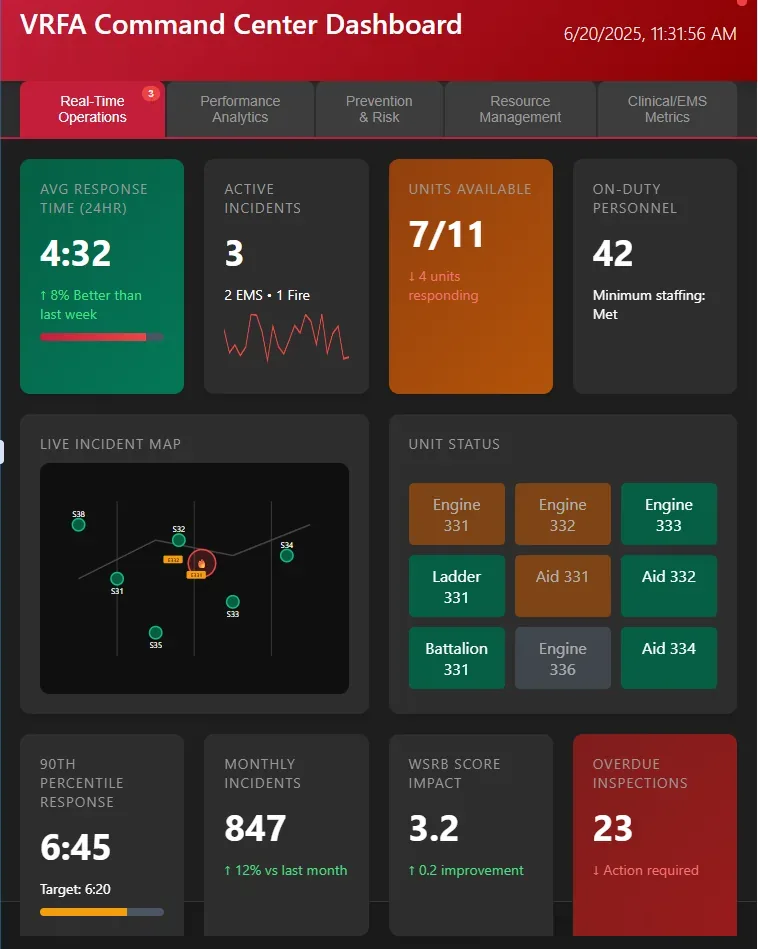
VRFA on these screens is the Vigilant Response Fire Authority, an agency we invented for demonstrations. Every number is sample data, not any real department’s. Member names on the training screen are blurred.
Command center
The duty officer’s view, and the summary that goes to the board.
Finance
For the CFO, the budget hearing and levy season.
Training compliance
For the training officer, and for the audit that asks.
WSRB protection class
For the rating evaluation, and the budget asks that follow it.
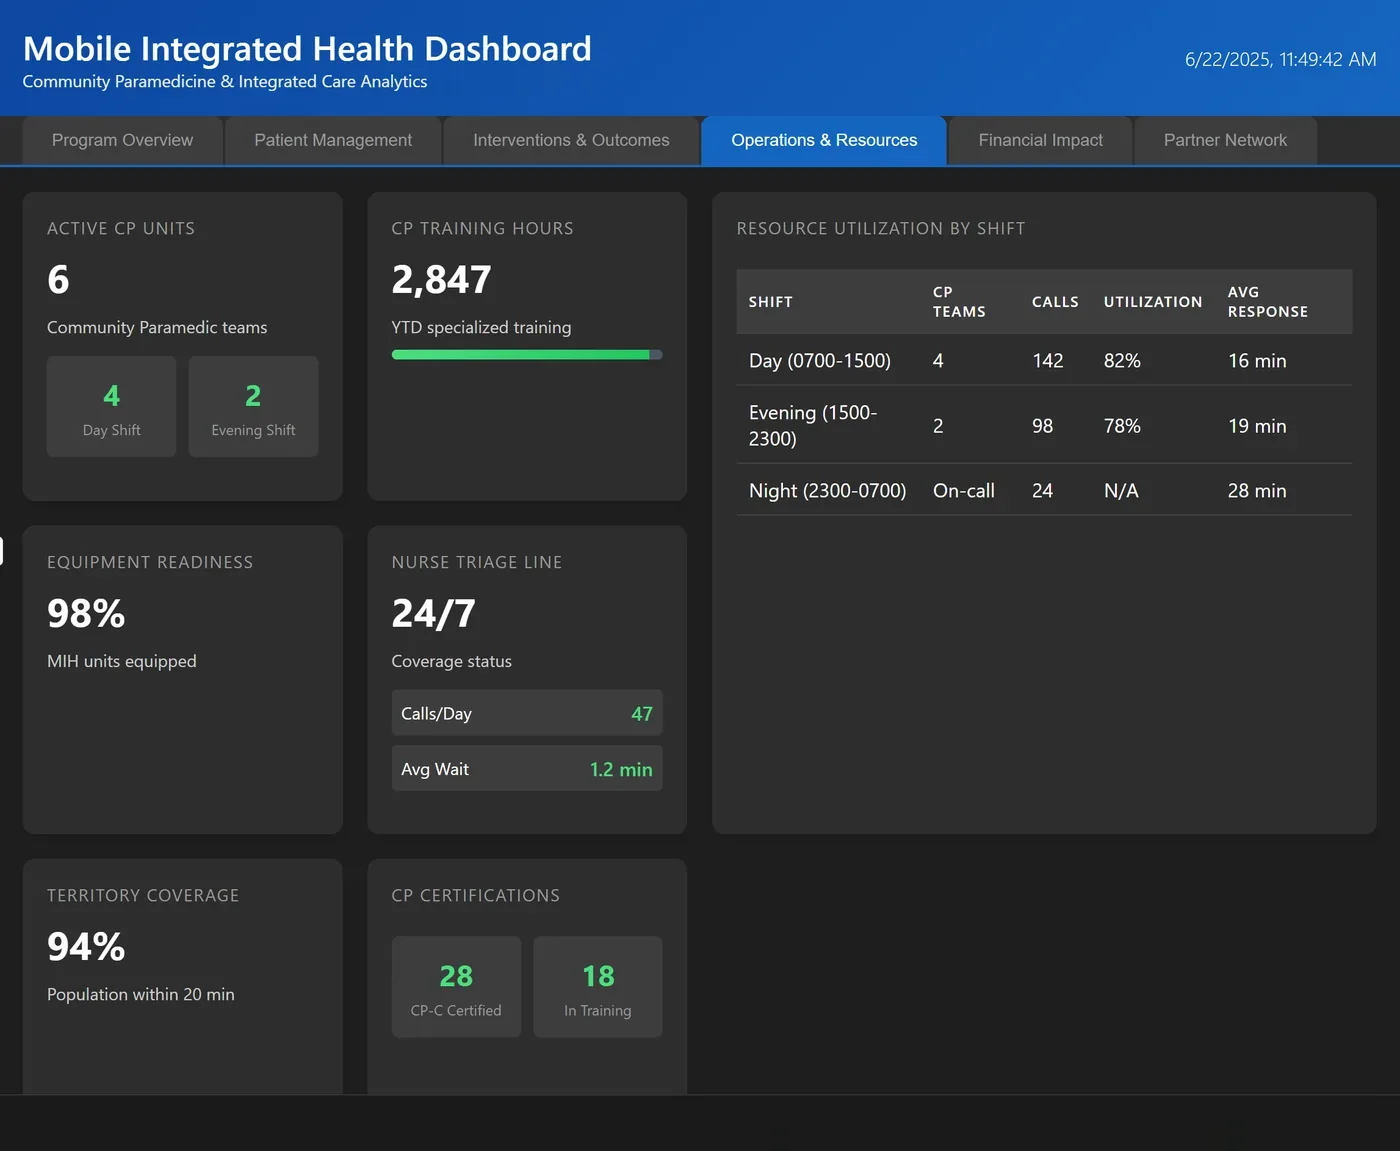
Mobile integrated health
For the program review with hospital, county and grant partners.
It reads the systems you already own
Reference architecture: your sources, into Microsoft Fabric, through Power BI, out to the wallboard, the phone and the board packet.
On GCC, Microsoft doesn’t support the capacity this design is drawn on, so we scope a GCC build on its own in the working session.
NERIS (API-first), weather, rivers, AQI, roads, fleet telematics, ArcGIS, Microsoft 365.
CAD extracts, ePCR reporting layers, checks & scheduling vendors — integration exists; we broker it.
PHI stays in your ePCR and your own Microsoft tenant, never ours. The SITREP shows counts and statuses, not patient records.
Crawl, walk, run
- Fabric + semantic model on your Microsoft 365 tenant
- Open feeds: weather, fire danger, roads, NERIS, calendar, inbox
- First wallboard: situational awareness + activity trends
You get: a first station wallboard.
- Vendor integrations: ePCR reporting, checks & inventory, scheduling
- Rig readiness, documentation queues, credential countdowns
- Crew and chief pages, with row-level security
You get: the full shift-start SITREP, both audiences.
- CAD status feeds — compliance & concurrency, continuously
- Hospital status, mission modules, Teams/SMS threshold alerts
- Board-packet PDF generated on schedule
You get: the board packet as a by-product of operations.
Built to be shown — to crews, boards, and auditors
Wallboards show counts and statuses, never patient identifiers. A page that needs PHI sits behind row-level security, your BAAs and audit logging.
Dispatch extracts are cut to fire and EMS incidents, law-enforcement fields removed, before they enter the reporting estate.
A district dashboard is disclosable. Aggregate-first design is meant to let the wallboard, the packet and the export be handed over on a records request.
We build every card to state its refresh window, and a stale feed to gray out rather than presenting old numbers as current.
See your department’s view.
A 45-minute working session: we walk your command staff through the working examples, then map your CAD, ePCR, checks, and scheduling systems onto the same pane. Bring ops and training: the crew view earns its keep with the people who stand roll call.
Every screen on this page shows sample data. VRFA (the Vigilant Response Fire Authority) and Silver Basin EMS are invented agencies.